GGPLOT - map_data
Turn data from the maps package in to a data frame suitable for plotting with ggplot2 and then convert them with ggplotly.
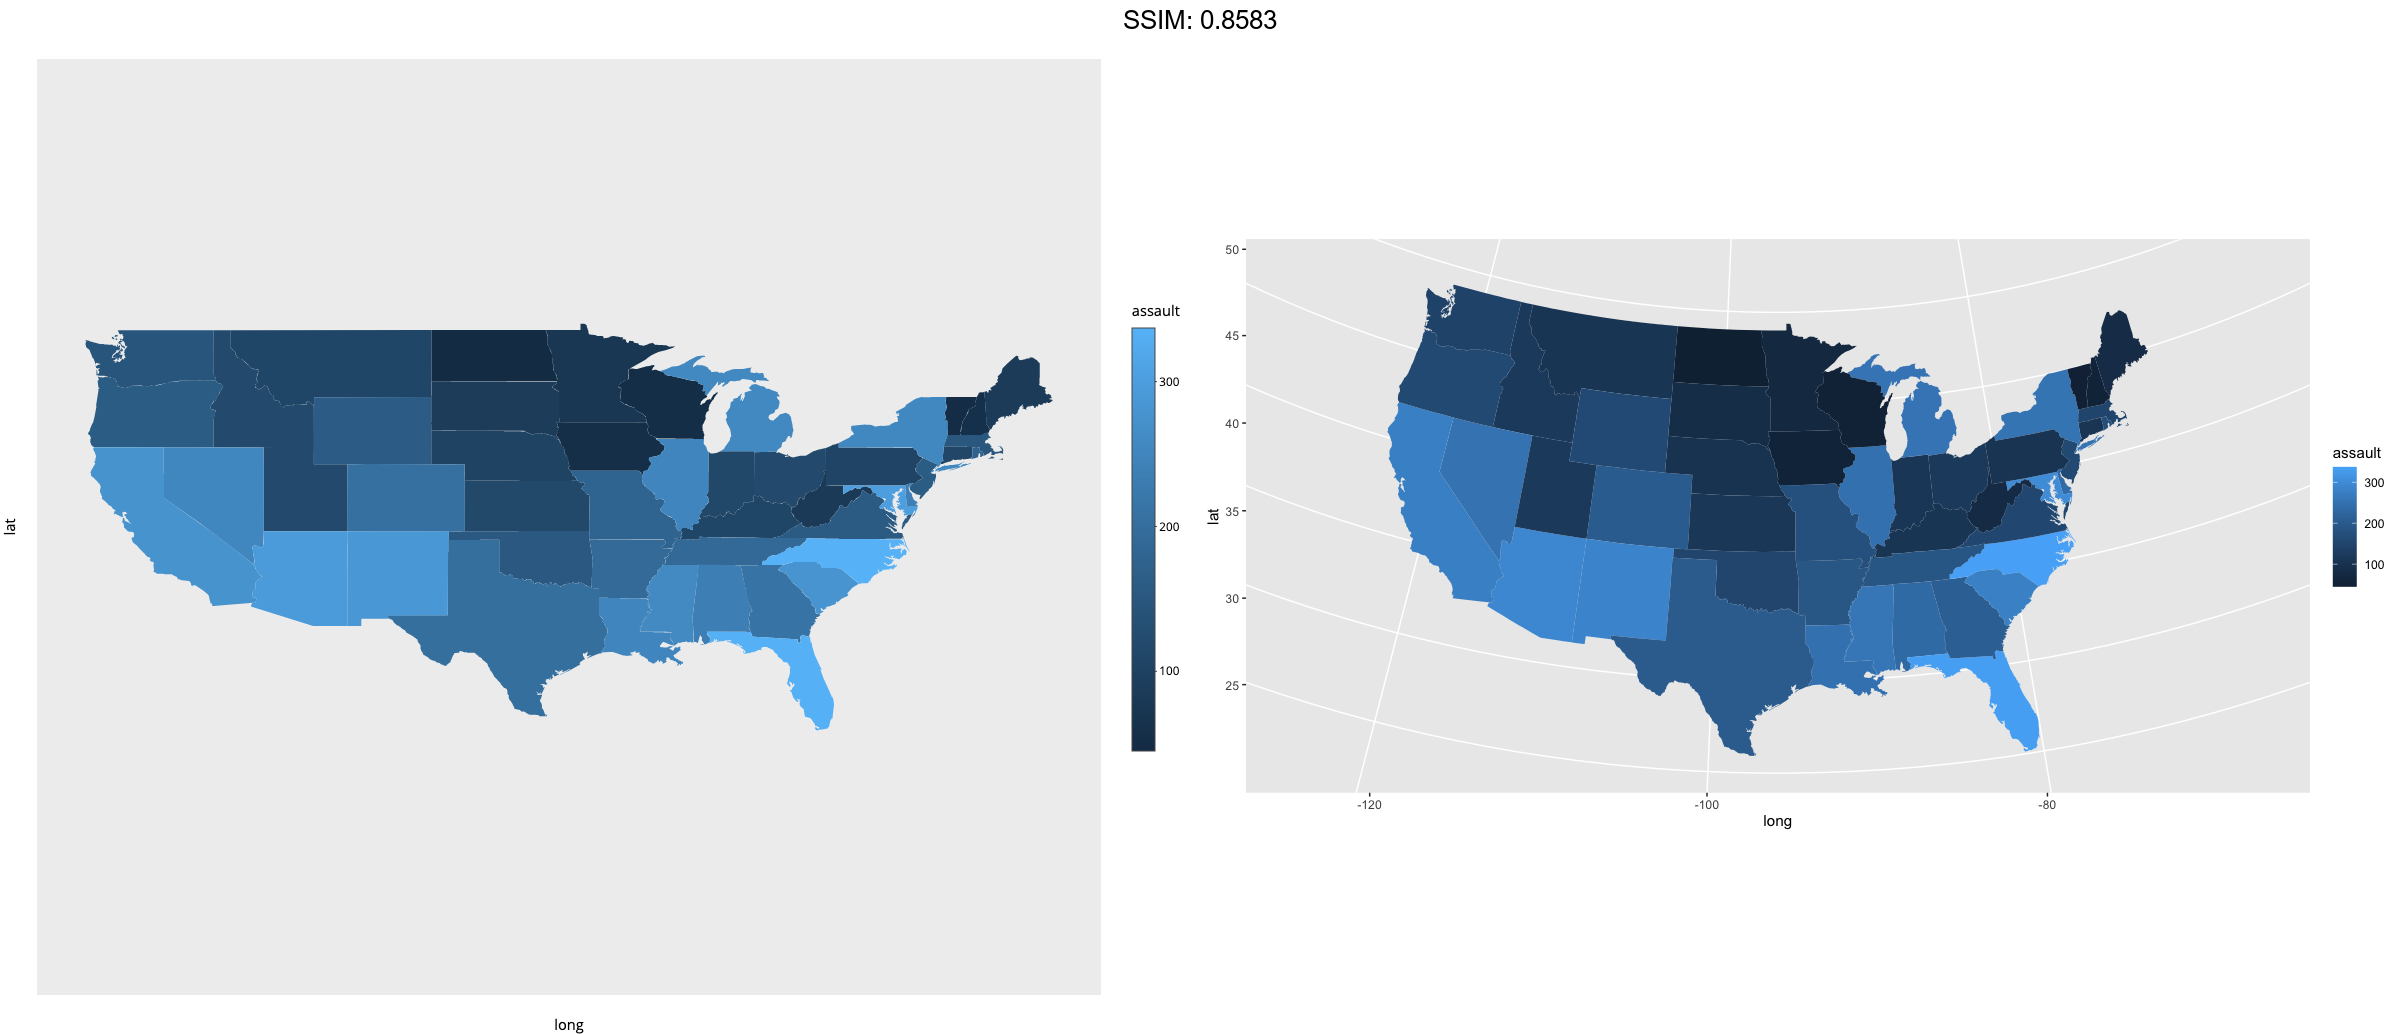
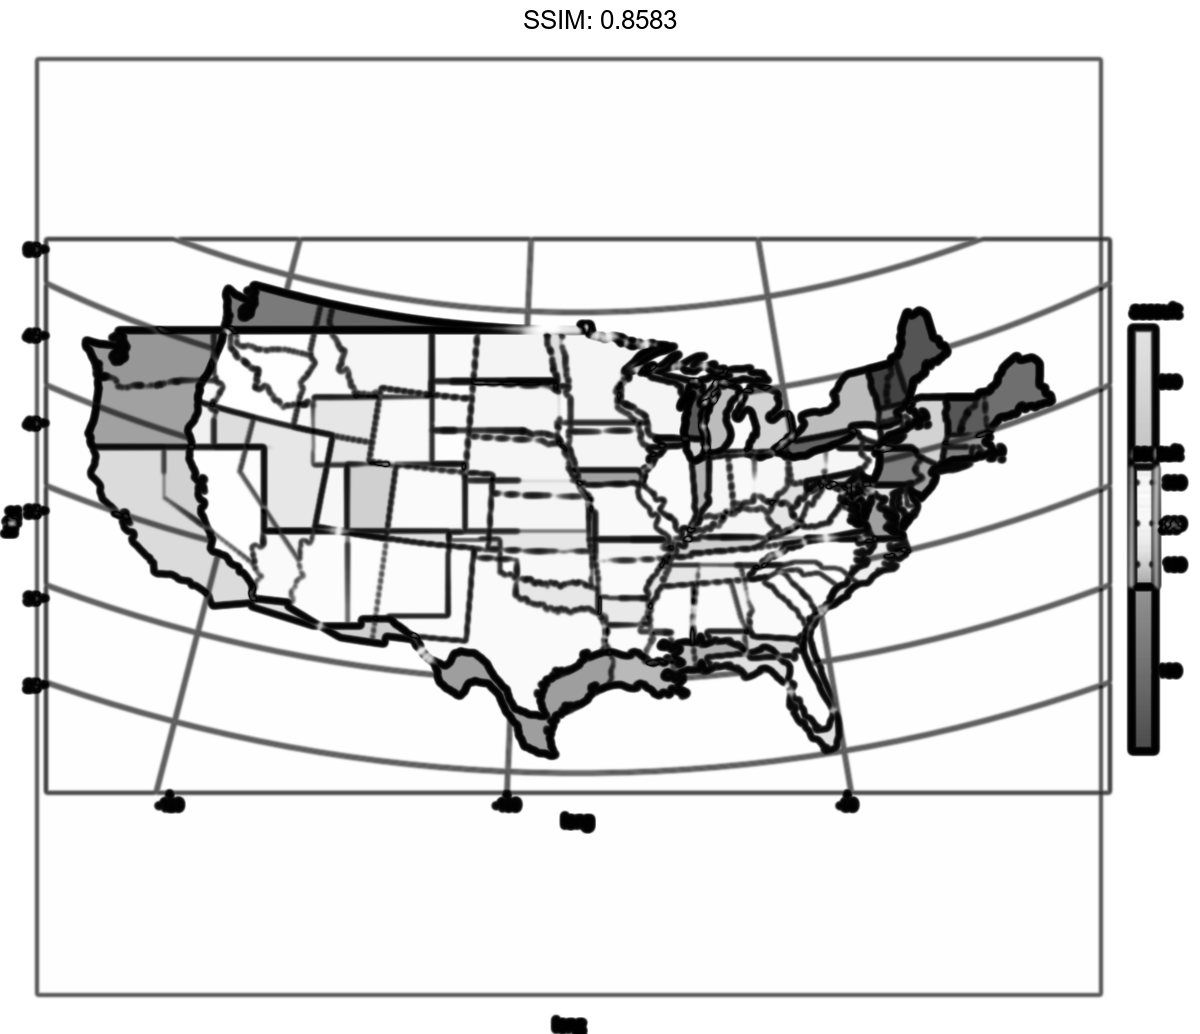
p <-
 if (require("maps")) {
states <- map_data("state")
arrests <- USArrests
names(arrests) <- tolower(names(arrests))
arrests$region <- tolower(rownames(USArrests))

choro <- merge(states, arrests, sort = FALSE, by = "region")
choro <- choro[order(choro$order), ]
ggplot(choro, aes(long, lat)) +
  geom_polygon(aes(group = group, fill = assault)) +
  coord_map("albers",  lat0 = 45.5, lat1 = 29.5)
}
plotly::ggplotly(p)

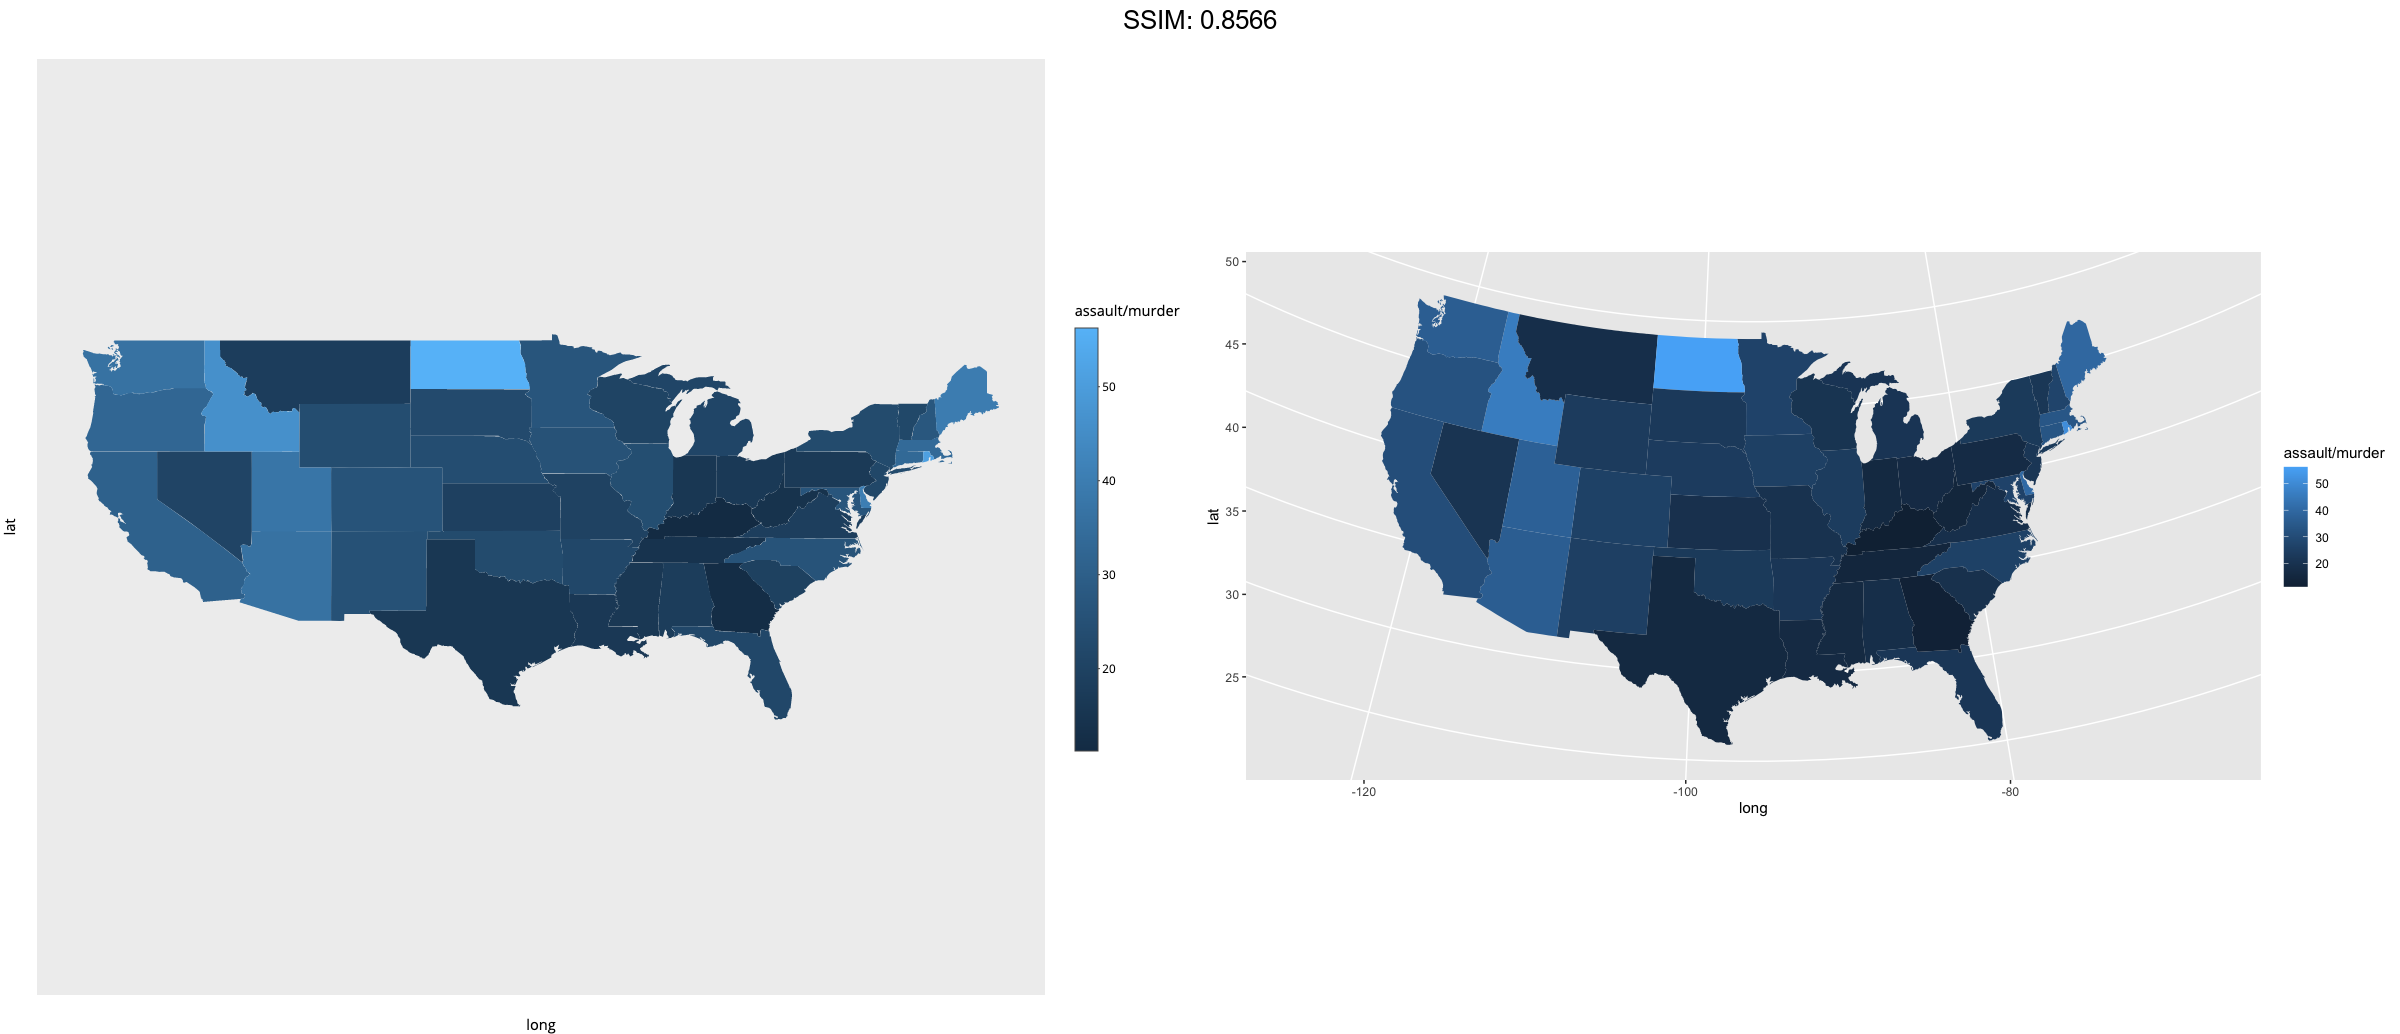
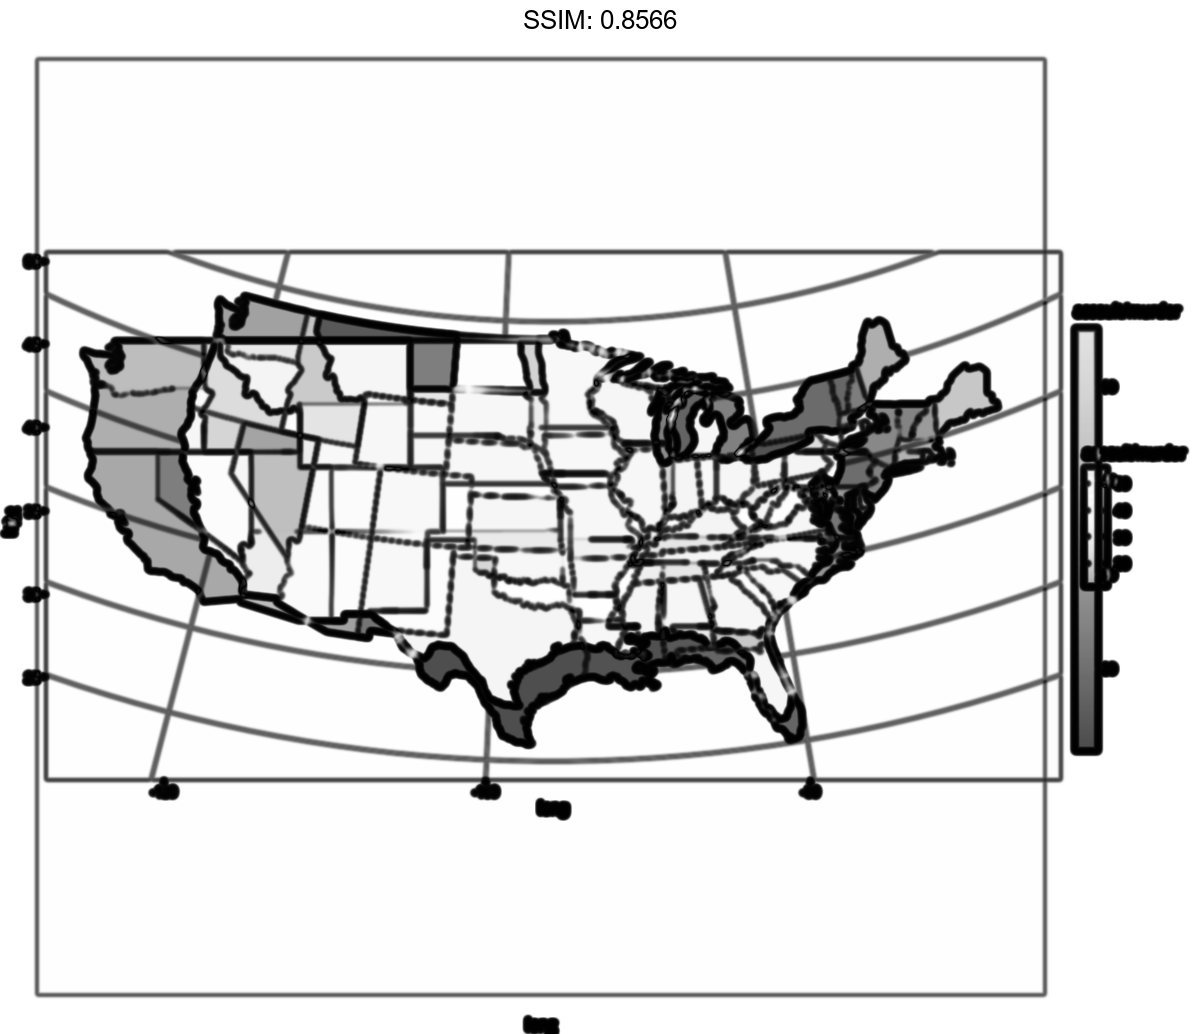
p <-
 if (require("maps")) {
ggplot(choro, aes(long, lat)) +
  geom_polygon(aes(group = group, fill = assault / murder)) +
  coord_map("albers",  lat0 = 45.5, lat1 = 29.5)
}
plotly::ggplotly(p)